Importing Spreadsheet-Like Data
RAdelaide 2025
The Kids Research Institute Australia
July 8, 2025
Importing Data
Data In R
- Working with data in R is very different to Excel
- Can have complicated structures or be simple (e.g.
x <- 1:5) - Spreadsheet-like data is very common
- Is known as a
data.frame- A common variant is known as a
tibble - These were originally called
tbl_dfobjects referring to SQL tables - Is just a
data.framewith some convenience features
- A common variant is known as a
Data In R
- We import the data as an
Robject- All analysis is performed on the
Robject - Almost never modify the source file
- All analysis is performed on the
- Once data is imported the source file is no longer involved
Common File Types
- Excel files (
xls/xlsx) have one or more spreadsheets- Can import one sheet at a time using
library(readxl)
- Can import one sheet at a time using
- Comma-separated Values (
.csv)- Plain text file
- Column-style data with commas delimiting the columns
- Resemble a single spreadsheet but:
- No formatting
- No formulas \(\implies\) only values
- No graphs/figures
Common File Types
- Tab-separated Values (
.tsv)- Like a
.csvbut with tabs separating columns
- Like a
- Sometimes see files saved as
.txt- Can be anything \(\implies\) need to check
Importing Data
When importing data into R:
- Cell formatting will be ignored by R
- Plots will also be ignored
- Blank rows/columns are not fatal, just annoying
- Mixtures of numbers and text in a column
data.framecolumns contain all the same type of value
- Deleted cells are sometimes imported as blank rows/columns
- Comma-separated or tab-separated files are often favoured for
R- i.e. plain text, or just the data
Other Common Excel Issues
If we’re not careful:
- Excel thinks everything is a date:
- Septin genes are now officially named SEPTIN2 etc (not SEPT2)
- Fractions are also not dates…
- Excel will remove leading zeroes (e.g. phone numbers, catalog ids)
- No record of any steps we’ve performed by clicking on something
- Very common sources of broken data \(\implies\) may need fixing
- ’000s of publications with dates for gene names in results
Preparation
File>New File>R Script(OrCtrl+Shift+N)- Save as
ImportPenguins.R
Preparation
- Download the file
data.zipfrom the workshop homepage - Place in your directory
RAdelaide25 Extract to herewhich should create a folder nameddata
Make sure your files are in data not in data/data
- This should contain all files for the workshop
- Navigate to the
datadirectory using theFilespane
(You should see penguins.csv in data)
Import Using the GUI
Importing Data
- Preview the file
penguins.csvby clicking on it (View File)- Try in Excel if you prefer, but DO NOT(!!!) save anything from Excel
- This is a common dataset as a simple
.csvfile - This type of data is very easy to manage in
R- Plain text with comma delimiters
- Simple column structure with column names
- No blank rows at the top or separating sub-tables
- No blank columns
- No rownames
Using the GUI To Load Data
Click on penguins.csv, choose Import Dataset then stop! 🛑
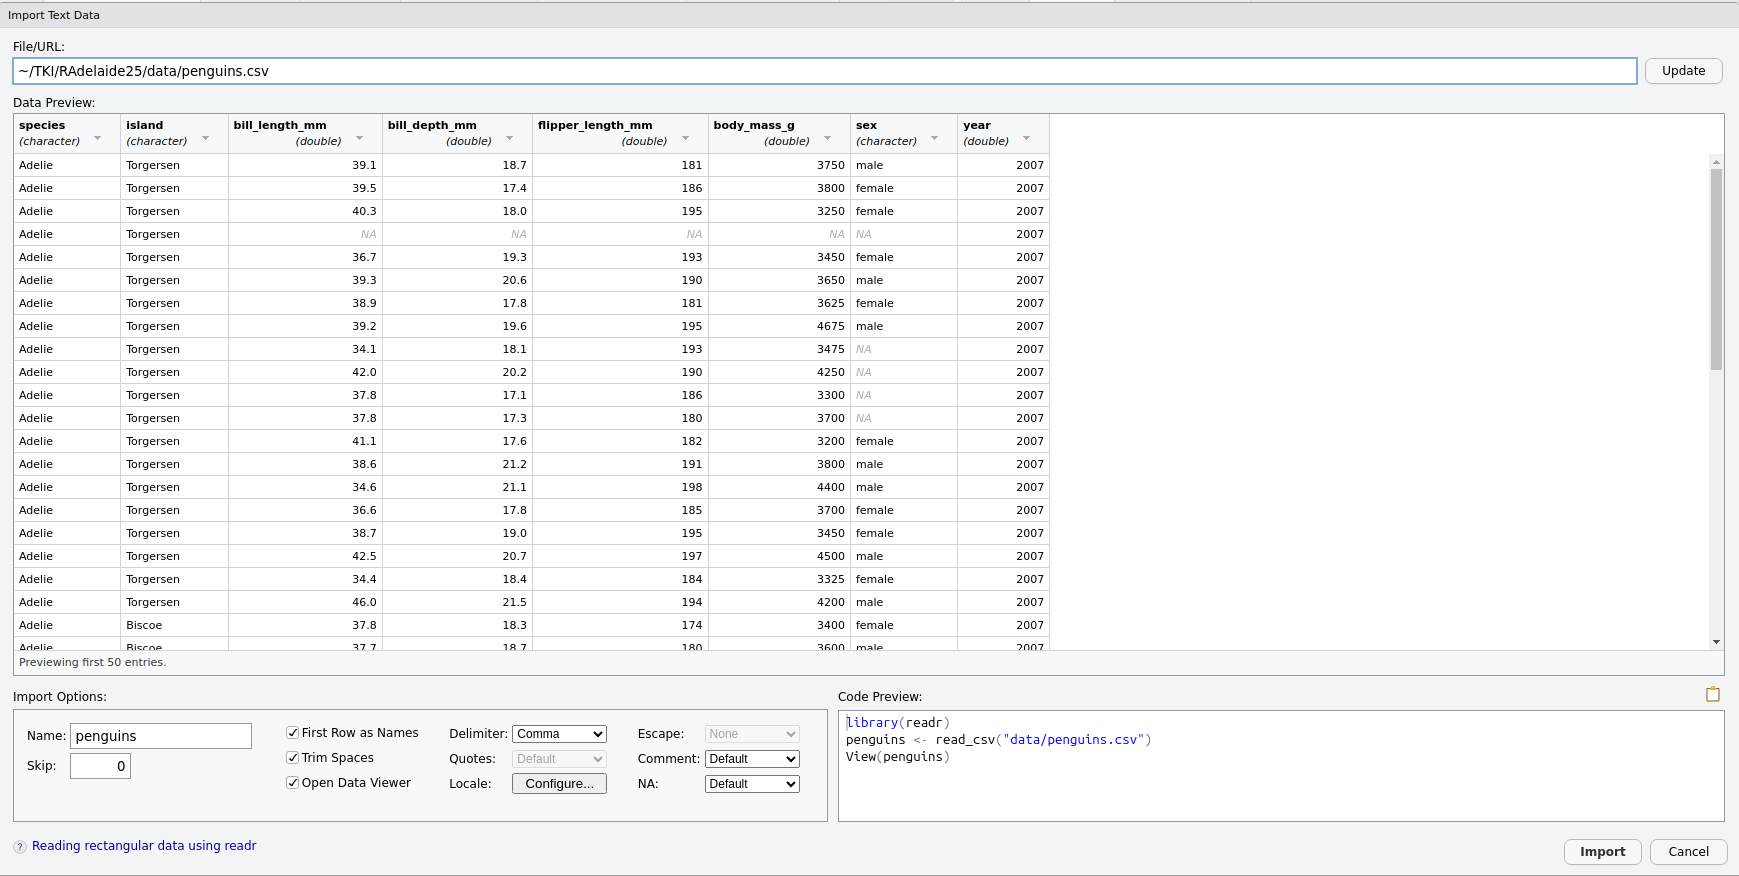
(Click Update if you don’t see this)
The Preview Window
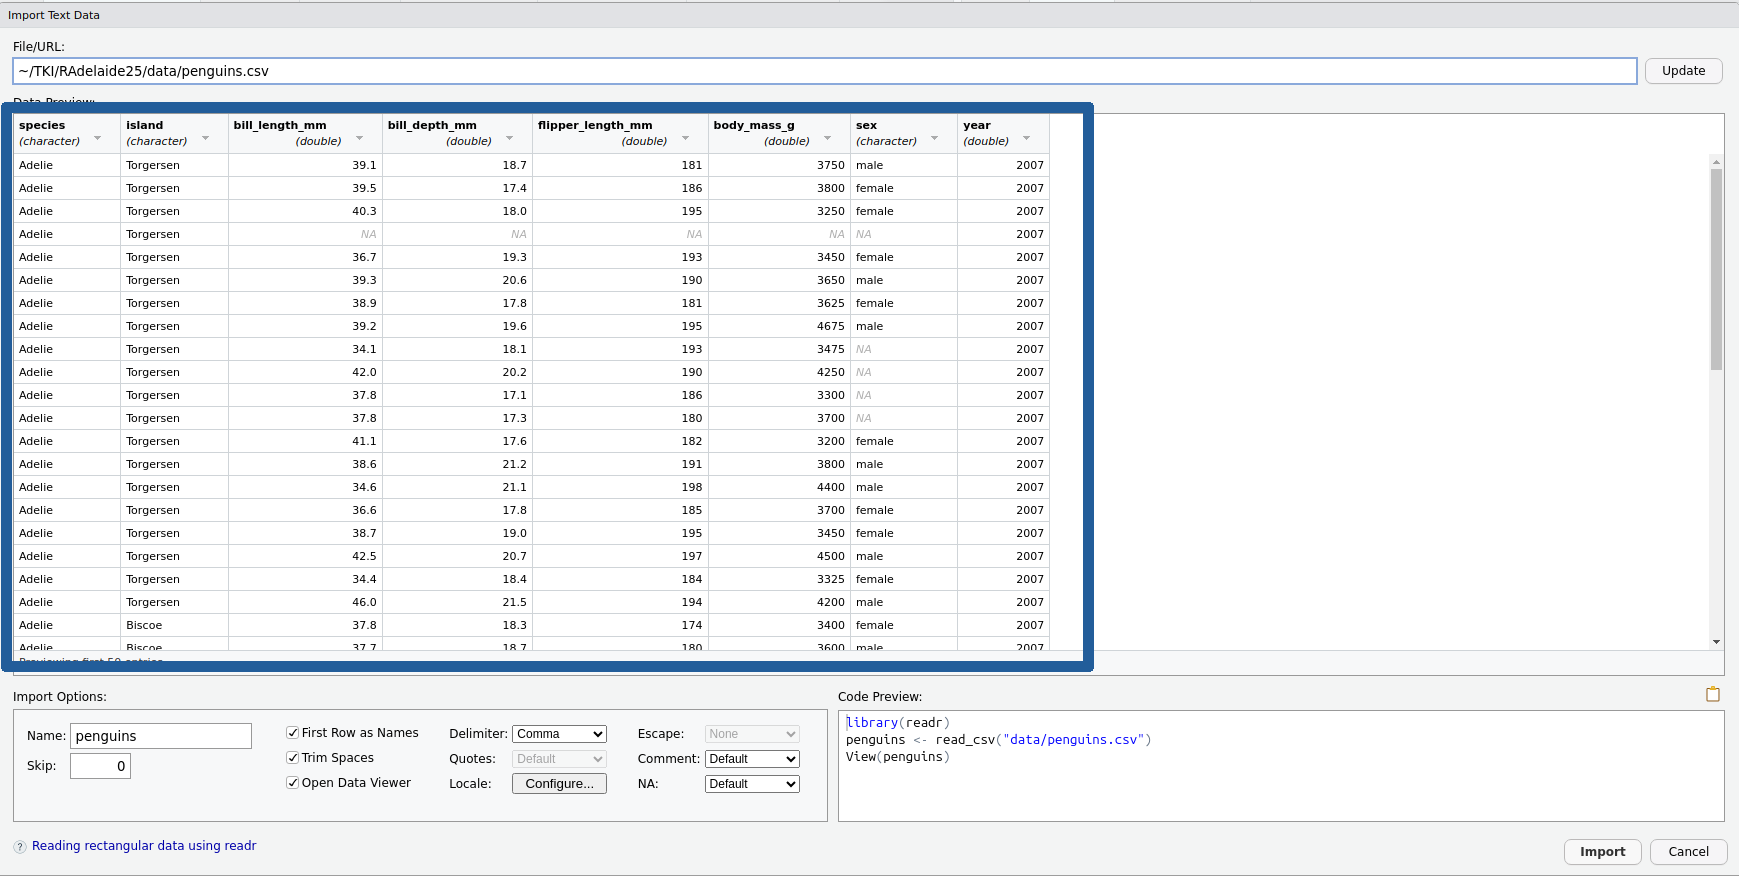
We have a preview of the data
The Preview Window
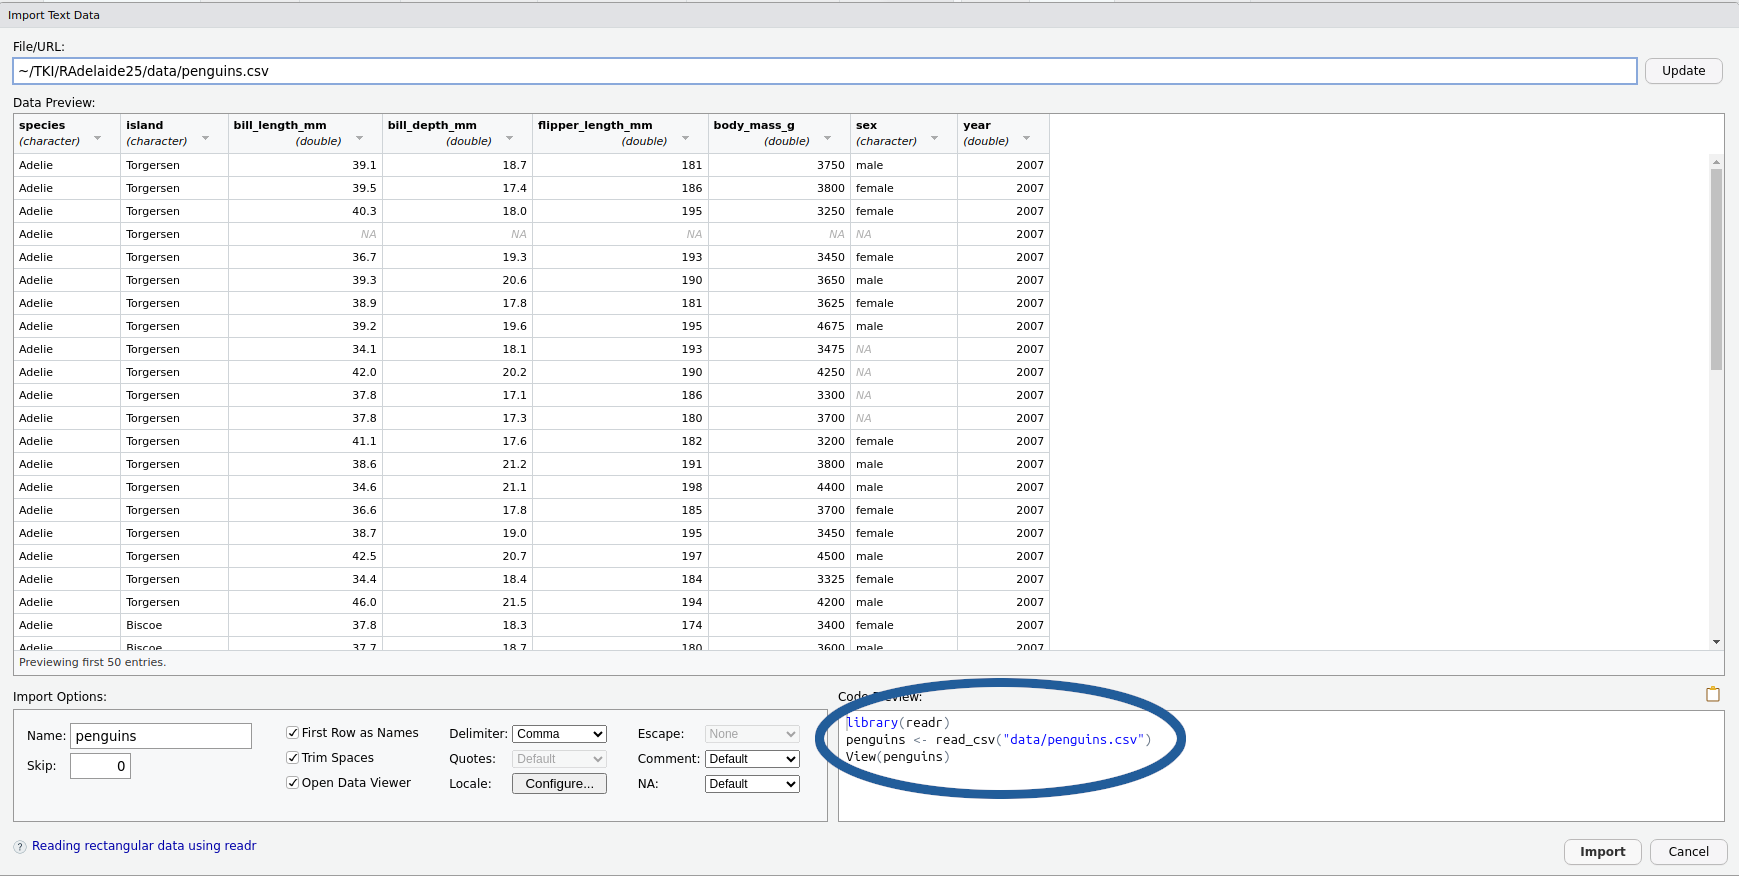
We also have a preview of the code we’re about to execute
The Preview Window
- Select and copy all the code in the
Code PreviewBox- We’ll paste this somewhere in a minute…
- Click
Import
- Magic happens!!!
- Ignore the coloured text. This is just ‘helpful information’
Now paste the copied code at the top of your script
What just happened?
The code we copied has 3 lines:
library(readr)loads the packagereadr- Packages are collections (i.e. libraries) of related functions
- All
readrfunctions are about importing data
readrcontains the functionread_csv()read_csv()tells R what to do with a csv file
What just happened?
The code we copied has 3 lines:
- This line actually loads the data into your
R Environment - It creates an object named
penguinsby using the file name (penguins.csv) - Can change this name if we wish
What just happened?
The code we copied has 3 lines:
- Opens a preview in a familiar
Excel-likeformat- I personally never use this
Close the preview by clicking the cross
What just happened?
- We have just loaded data using the default settings of
read_csv() - The object
penguinsis now in ourR Environment- The original file remains on our HDD without modification!!!
- The code is saved in our script
\(\implies\) we don’t need the GUI for this operation again!
Let’s Demonstrate
- In the
Environment Tabclick the broom icon 🧹- This will delete everything from your
R Environment - It won’t unload the packages
- This will delete everything from your
- Highlight the code we’ve just pasted and click
Run- Reloading the packages won’t hurt
- Check the
Environment Tabagain andpenguinsis back
You can delete the line View(penguins)
Our First R Script
- This is now our first R script
- An R script is a plain text file
- No objects are stored
- Individual lines can be run using
Ctrl/Cmd + Enter - Can select multiple lines & run
Our First R Script
- Insert a new line before
library(readr)then type
- This is a comment \(\implies\) no executable code
- Communicates to “future” you what you’re doing
- Only needs a single
#to be a comment
Our First R Script
- Insert a line after
library(readr)then enter
Data Frame Objects
Data Frame Objects
- The object
penguinsis known as adata.frame- Very similar to an SQL table
Requivalent to a spreadsheet- Must have column names
- row names becoming less common (sometimes just the row numbers)
- Missing values (blank cells) are usually filled with
NA
Data Frame Objects
Instead of View() \(\implies\) preview by typing the object name
# A tibble: 344 × 8
   species island    bill_length_mm bill_depth_mm flipper_length_mm body_mass_g
   <chr>   <chr>              <dbl>         <dbl>             <dbl>       <dbl>
 1 Adelie  Torgersen           39.1          18.7               181        3750
 2 Adelie  Torgersen           39.5          17.4               186        3800
 3 Adelie  Torgersen           40.3          18                 195        3250
 4 Adelie  Torgersen           NA            NA                  NA          NA
 5 Adelie  Torgersen           36.7          19.3               193        3450
 6 Adelie  Torgersen           39.3          20.6               190        3650
 7 Adelie  Torgersen           38.9          17.8               181        3625
 8 Adelie  Torgersen           39.2          19.6               195        4675
 9 Adelie  Torgersen           34.1          18.1               193        3475
10 Adelie  Torgersen           42            20.2               190        4250
# ℹ 334 more rows
# ℹ 2 more variables: sex <chr>, year <dbl>
Data Frame Objects
Gives a preview up to 10 lines with:
- The object type:
A tibble - The full dimensions:
60 X 3 - Column names: species, island, bill_length_mm, bill_depth_mm, flipper_length_mm, body_mass_g, sex and year
- Data types:
<chr>,<chr>,<dbl>etc
I personally find this more informative than View()
Tibble Objects
readruses a variant called atbl_dfortbl(pronounced tibble)- A
data.framewith convenient features - Similar to a SQL table
- Can only have row numbers for row names
- Is a foundational structure in the
tidyverse
- A
The Tidyverse
- The
tidyverseis a collection of thematically-linked packages- Produced by developers from RStudio/Posit
- Often referred to as tidy-programming or similar
- Calling
library(tidyverse)loads multiple key packagesreadris one of these \(\implies\) usually just load the tidyverse- Will load
dplyr,tidyr,readr,ggplot2+ others
The Tidyverse
- Replace
library(readr)withlibrary(tidyverse) - Execute this line
- This will load all core packages from the tidyverse
- Reloading a package has no effect (is ignored)
Previewing Objects
- Some additional ways to inspect tibbles are:
glimpseis loaded withlibrary(tidyverse)
What were the differences between each method?
Functions
Functions in R
- Here we have called the functions
head()andglimpse()- They were both executed on the object
penguins
- They were both executed on the object
Functions in R
- The key place to look at is
- there are two arguments to
head()\(\implies\)xandnxhas no default value \(\implies\) we need to provide somethingn = 6Lmeansnhas a default value of 6 (L \(\implies\)integer)
Functions in R
Lower down the page you’ll see
Arguments
x an object
n an integer vector of length up to dim(x) (or 1, for non-dimensioned objects). Blah, blah, blah…
- Some of the rest is technical detail (can sometimes be very helpful)
Function Arguments
head()prints the first part of an object- Useful for very large objects (e.g. if we had 1000 penguins)
- We can change the number of rows shown to us
# A tibble: 4 × 8
  species island    bill_length_mm bill_depth_mm flipper_length_mm body_mass_g
  <chr>   <chr>              <dbl>         <dbl>             <dbl>       <dbl>
1 Adelie  Torgersen           39.1          18.7               181        3750
2 Adelie  Torgersen           39.5          17.4               186        3800
3 Adelie  Torgersen           40.3          18                 195        3250
4 Adelie  Torgersen           NA            NA                  NA          NA
# ℹ 2 more variables: sex <chr>, year <dbl>
Function Arguments
- If passing values in order \(\implies\) no need for names
# A tibble: 4 × 8
  species island    bill_length_mm bill_depth_mm flipper_length_mm body_mass_g
  <chr>   <chr>              <dbl>         <dbl>             <dbl>       <dbl>
1 Adelie  Torgersen           39.1          18.7               181        3750
2 Adelie  Torgersen           39.5          17.4               186        3800
3 Adelie  Torgersen           40.3          18                 195        3250
4 Adelie  Torgersen           NA            NA                  NA          NA
# ℹ 2 more variables: sex <chr>, year <dbl># A tibble: 4 × 8
species island bill_length_mm bill_depth_mm flipper_length_mm body_mass_g
<chr> <chr> <dbl> <dbl> <dbl> <dbl>
1 Adelie Torgersen 39.1 18.7 181 3750
2 Adelie Torgersen 39.5 17.4 186 3800
3 Adelie Torgersen 40.3 18 195 3250
4 Adelie Torgersen NA NA NA NA
# ℹ 2 more variables: sex <chr>, year <dbl>Function Arguments
- If we explicitly name arguments \(\implies\) can pass in any order
# A tibble: 4 × 8
  species island    bill_length_mm bill_depth_mm flipper_length_mm body_mass_g
  <chr>   <chr>              <dbl>         <dbl>             <dbl>       <dbl>
1 Adelie  Torgersen           39.1          18.7               181        3750
2 Adelie  Torgersen           39.5          17.4               186        3800
3 Adelie  Torgersen           40.3          18                 195        3250
4 Adelie  Torgersen           NA            NA                  NA          NA
# ℹ 2 more variables: sex <chr>, year <dbl>
Function Arguments
- Check the help page for
glimpse()- This is from the package
pillar
- This is from the package
- Try changing the
widthargument to see what happens- Default value auto-detects screen width
Understanding read_csv()
- Earlier we called the
Rfunctionread_csv() - Check the help page
- We have four functions shown but stick to
read_csv()
Understanding read_csv()
read_csv(
  file,
  col_names = TRUE, col_types = NULL, col_select = NULL,
  id = NULL, locale = default_locale(),
  na = c("", "NA"), quoted_na = TRUE,
  quote = "\"", comment = "",
  trim_ws = TRUE,
  skip = 0, n_max = Inf,
  guess_max = min(1000, n_max),
  name_repair = "unique",
  num_threads = readr_threads(),
  progress = show_progress(),
  show_col_types = should_show_types(),
  skip_empty_rows = TRUE,
  lazy = should_read_lazy()
)- This function has way too many arguments (
file,col_namesetc.) - Most have default values given
col_names = TRUE\(\implies\) column names assumed as the first row
Understanding read_csv()
All arguments were defined somewhere in the GUI.
- Open the GUI Preview by clicking on the file again
- Uncheck the
First Row as Namescheck-box
- What happened to the code?
- How did the columns change?
Try clicking/unclicking a few more & try understand the consequences
Understanding read_csv()
- Column types can also be set using shorthand
- “ccnnnncn” is a mix of character & number columns
- Changing one of the character columns to “n” will lead to
NAs - Changing the numeric column to character would mean … ?
Closing Comments
read_csv() Vs read.csv()
RStudionow usesread_csv()fromreadrby default- You will often see
read.csv()(fromutils) in older scripts - The newer (
readr) version is:- slightly faster
- more user-friendly
- handles large files more efficiently via indexing
- gives informative messages
- Earlier functions in
utilsareread.*()(csv, delim etc.) readrhas the functionsread_*()(csv, tsv, delim etc.)- I always use the newer ones
Loading Excel Files
- The package
readxlis for loading.xlsandxlsxfiles. - Not part of the core tidyverse but very compatible
Loading Excel Files
- This file contains multiple sheets
- Once again we can click on the file \(\implies\)
Import DatasetSheet1looks pretty simple- First column has no name
- Use the drop-down menu to look at the
Sheet2&Sheet3 - We’ll learn how to manage these as challenges later
![]()